Instructions
- STEP 1:Make connections by dragging nodes from apparatus to the circuit.
- STEP 2:Check your connections by clicking on the 'CHECK' button.
- STEP 3:Set the values of resistances R1, R2, R3 by adjusting the sliders on left, these values will remain constant throughout the experiment.
- STEP 4:Click on the ‘Power’ button to turn on the power supply.
- STEP 5:Now, vary the voltage value by moving the voltage slider to the right side, the readings on the voltmeter will change accordingly.
- STEP 6:Click on the ‘ADD’ button to add the readings to the observation table.
- STEP 7:Repeat steps 6 and 7 until we reach to the 6th reading (Minimum reading to be taken to plot the graph is 6).
- STEP 8:To Verify the KVL, Compare the theoretically calculated values with the practical one.
- STEP 9: Click on the ‘PLOT’ button to display the graph.
- STEP 10: Click on ‘PRINT’ button to take out the print of the page.
- STEP 11: Click on ‘RESET’ button to refresh the page.
-
(a)Connect power-supply to the circuit. (1-9, 2-10).
(b)Connect voltmeter (3-11, 4-12) and (5-13, 6-14) and (7-15, 8-16) or you can connect any voltmeter to any resistance in circuit.
(c)Click on the label to delete all the connections for the corresponding nodes.
Instructions
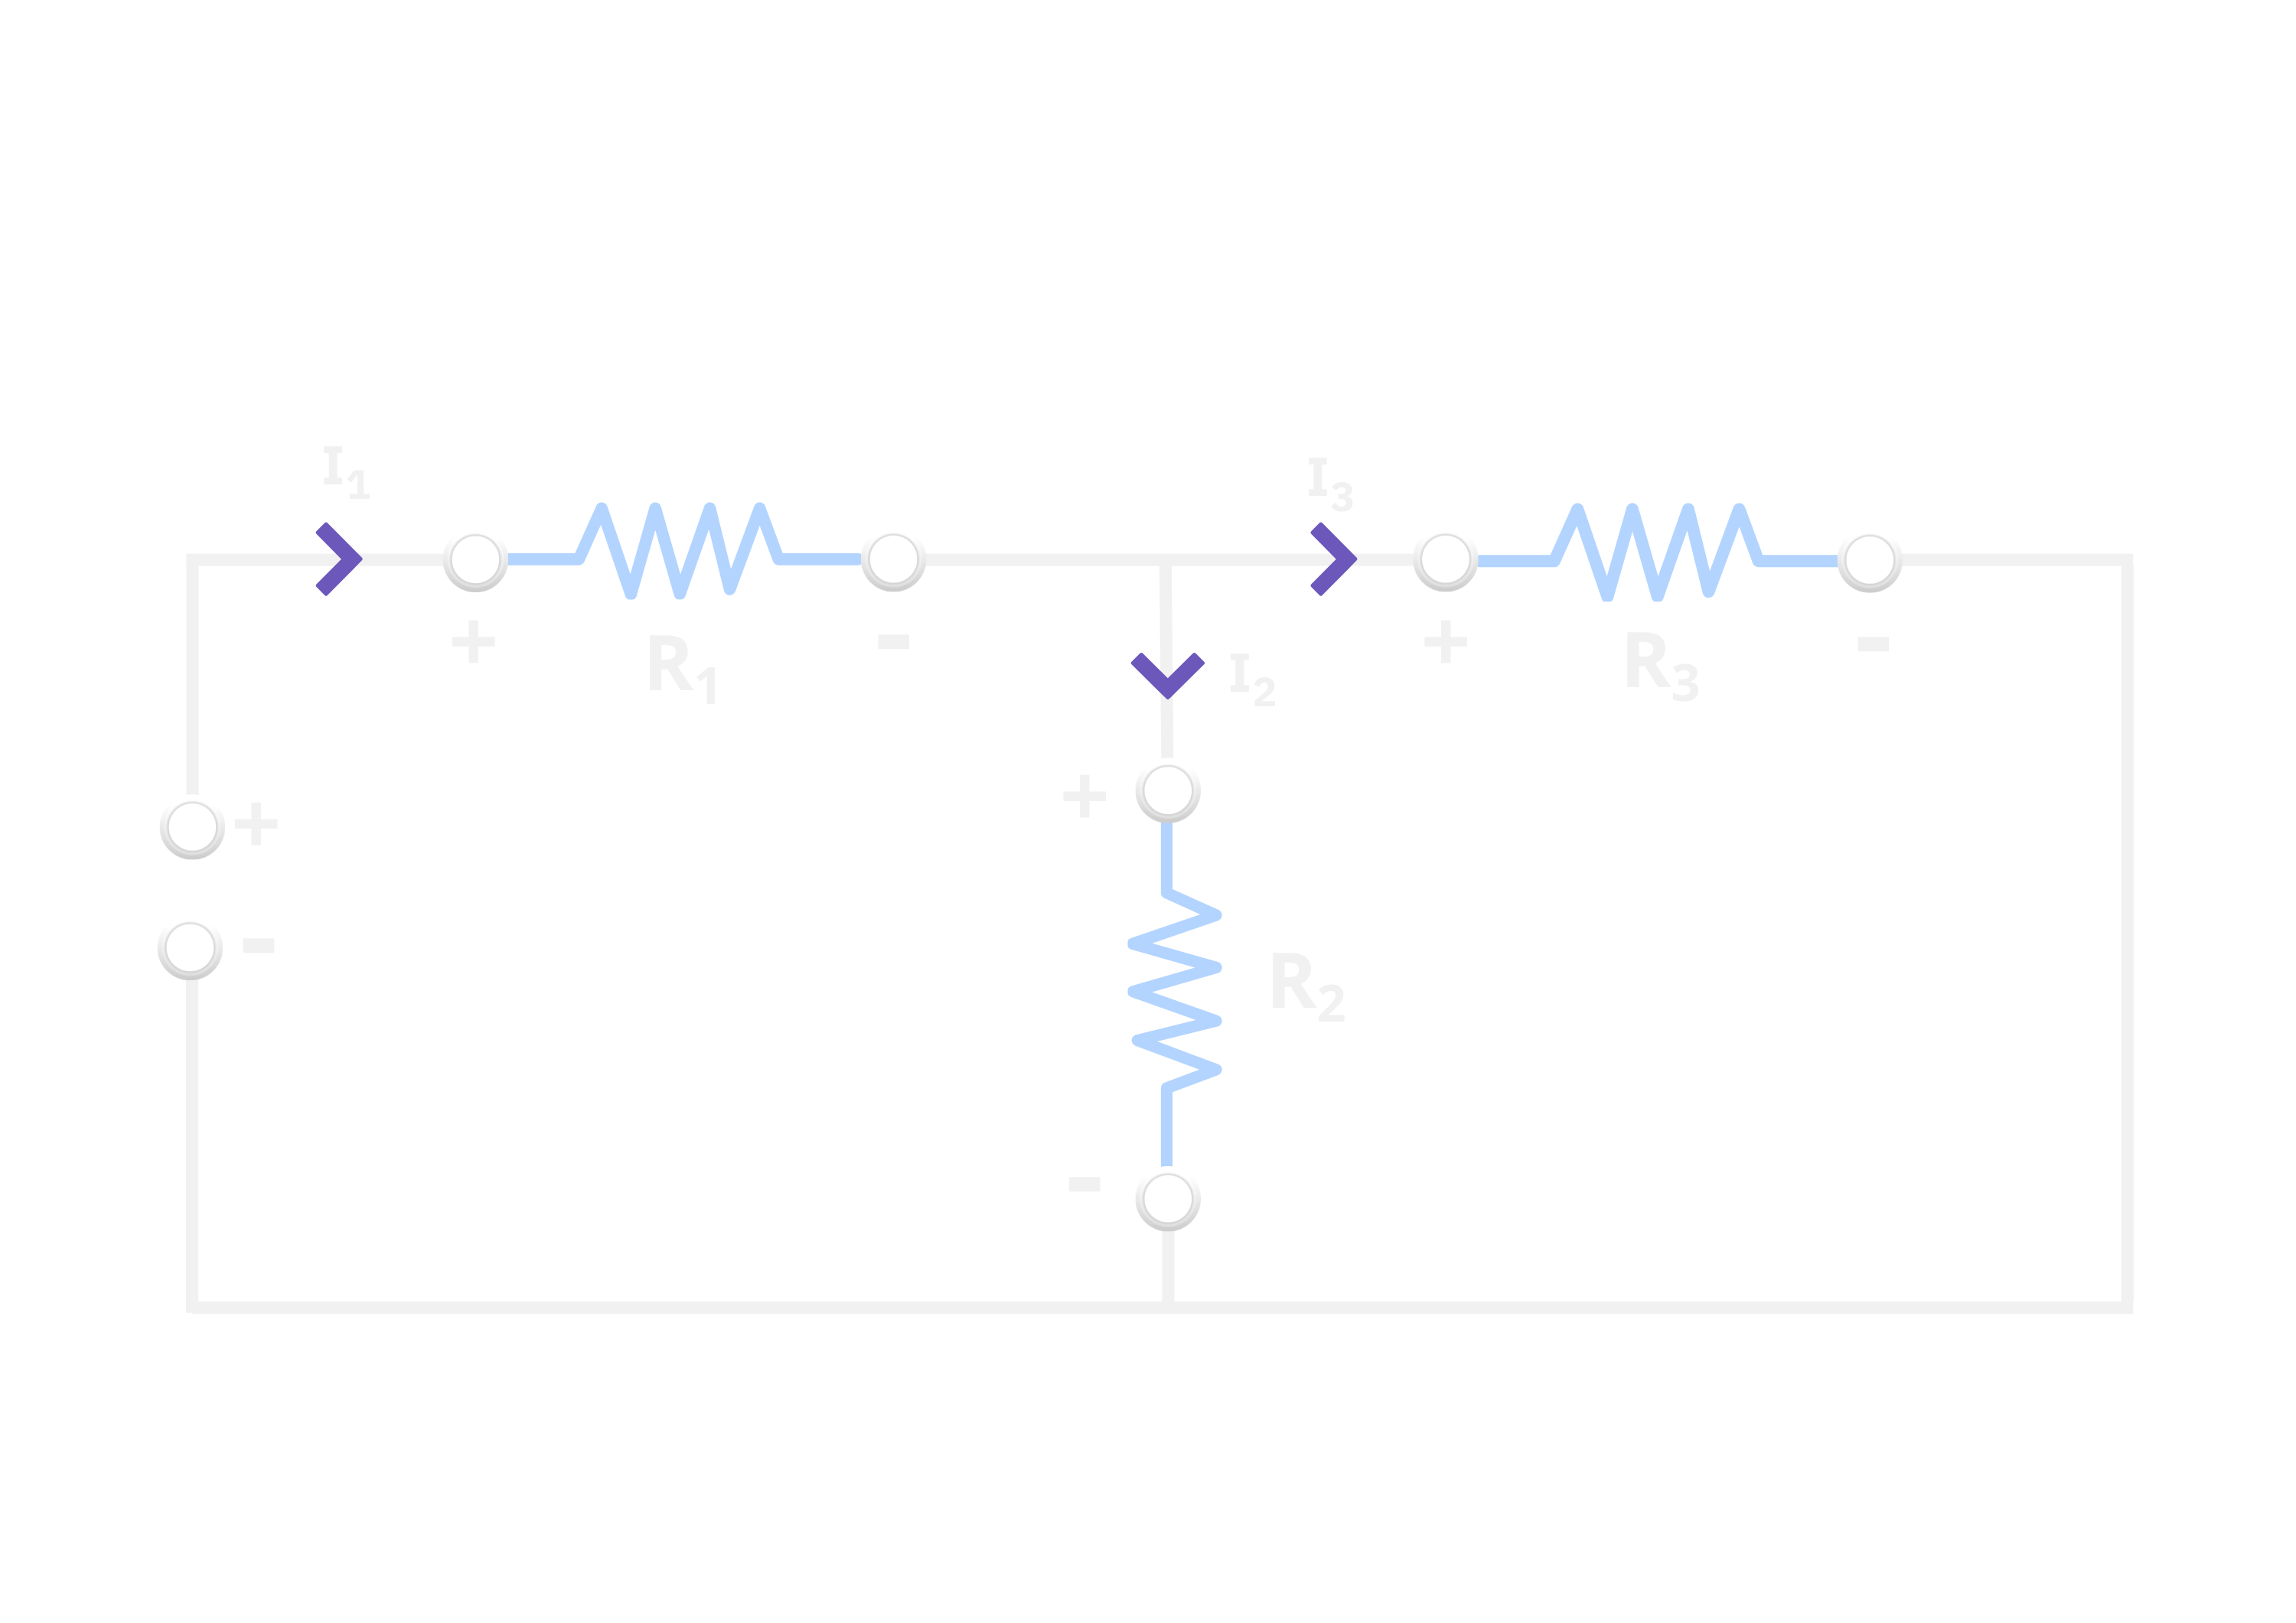
TO VERIFY KIRCHHOFF'S VOLTAGE LAW
s


OBSERVATION TABLE
| S.No | Voltage(Power supply) | V1(V) | V2(V) | V3(V) |
|---|
GRAPH